
How Convection-Allowing Models Have Changed Our World
-Gail Hartfield
For operational forecasters, and particularly for those issuing and/or communicating severe weather watches and warnings, the proliferation of convection-allowing models (CAMs) in recent years has been nothing short of game-changing. For decades, forecasters had to rely on very coarse temporal and spatial resolution depictions of precipitation from models that were run just twice a day using parameterization methods to represent the convective processes, which occurred on a scale much smaller than the model resolutions. As such, they lacked the smaller-scale details important for convection. Certainly, severe weather forecasters were still knowledgeable about the broad-scale patterns that generated and influenced convection, and they were cognizant of the factors important in shaping the mesoscale environment and triggering severe convection. They used this knowledge and understanding to predict the most likely timing and mode of convection, although it was easy to be off by several hours and to miss crucial details of convection, such as isolated severe cells ahead of a squall line.
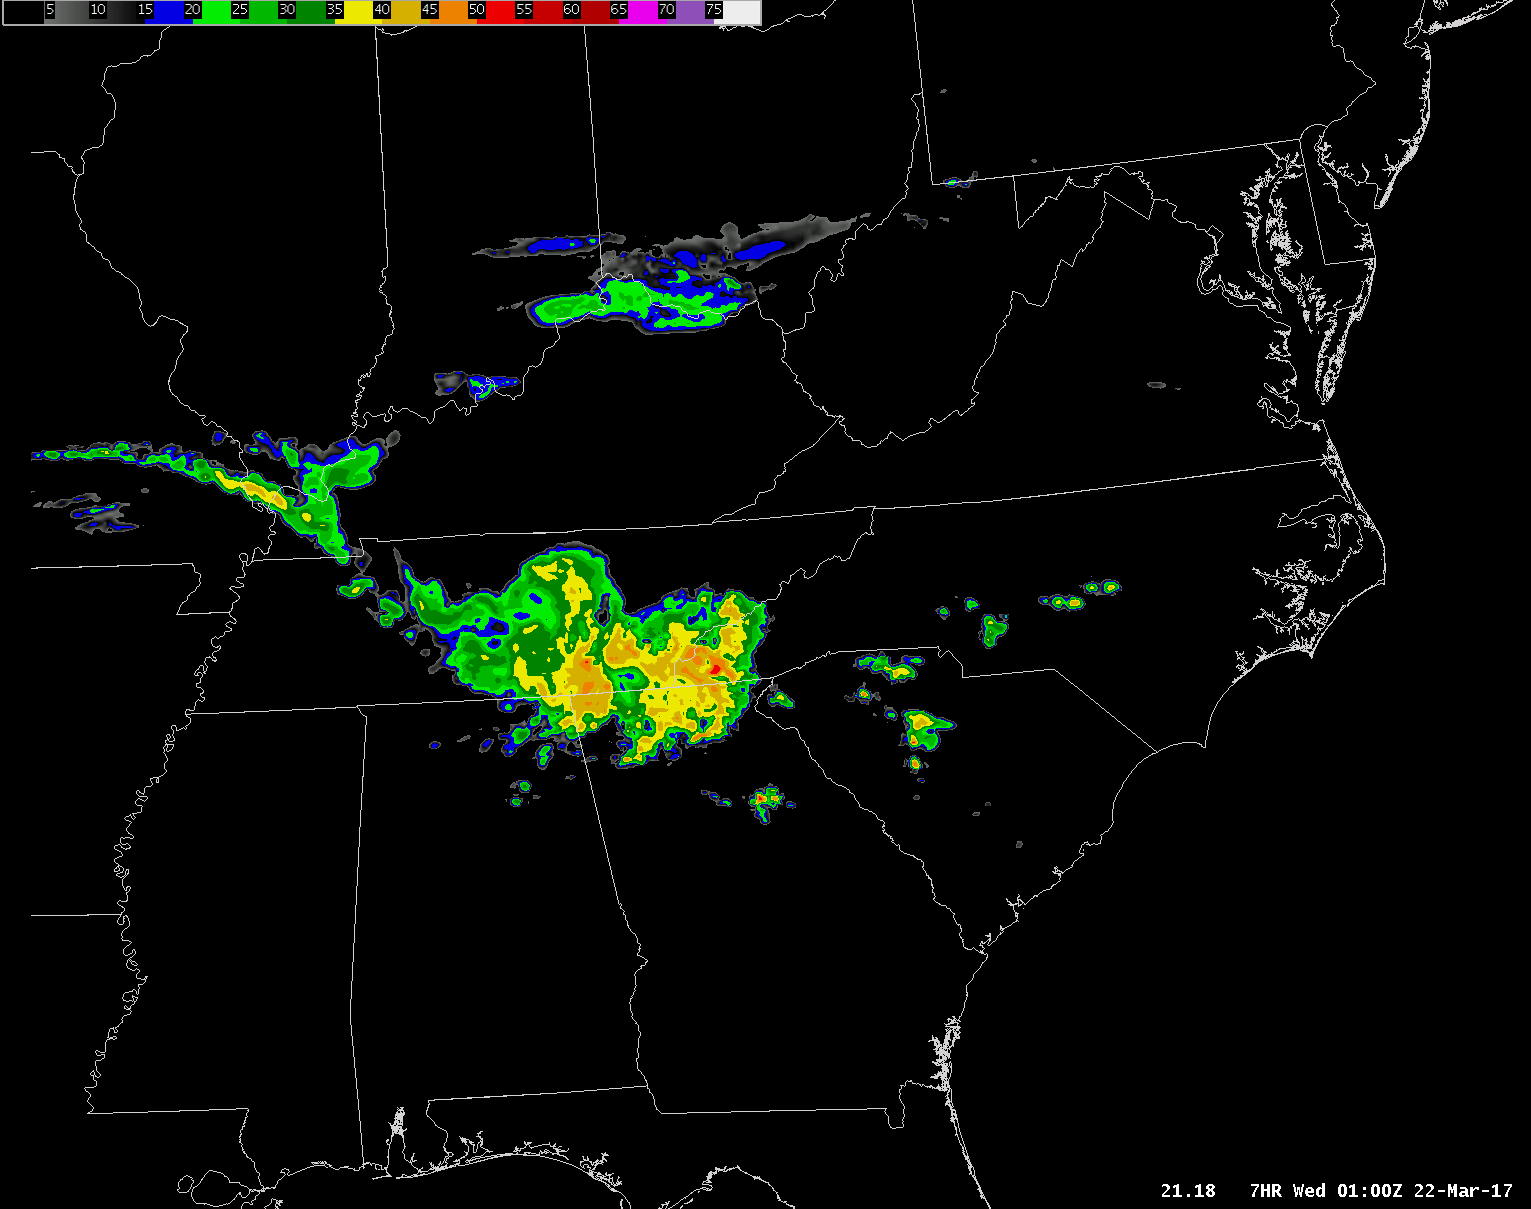
1-km simulated reflectivity from the HRRR model, valid 0100 UTC 22 March 2017
Beginning with the first CAMs and their introduction into experimental forecasts 10 to 15 years ago, forecasters have been able to provide an increasingly accurate level of specificity regarding convection timing, storm mode, evolution, and primary threats. What used to be represented with a broad swath of multi-hour precipitation can now be depicted much closer to the scale of reality, with stark detail including individual updrafts, bowing segments, and outflows. No longer are we restricted to conveying a generalized severe outlook based on a couple of coarse models; today, we can take advantage of numerous CAMs developed by groups including (but not limited to) the National Center for Atmospheric Research (NCAR), NCEP’s Environmental Modeling Center (EMC), Center for Analysis and Prediction of Storms (CAPS), National Severe Storms Laboratory (NSSL), and the Earth Systems Research Laboratory/Global Systems Division (ESRL/GSD). These CAMs, with 4-km or less grid spacing, are run several times a day providing hourly (and even sub-hourly) simulated radar imagery that looks amazingly real. This can help us provide very specific information about timing, location and threat to partners, clients and the public.
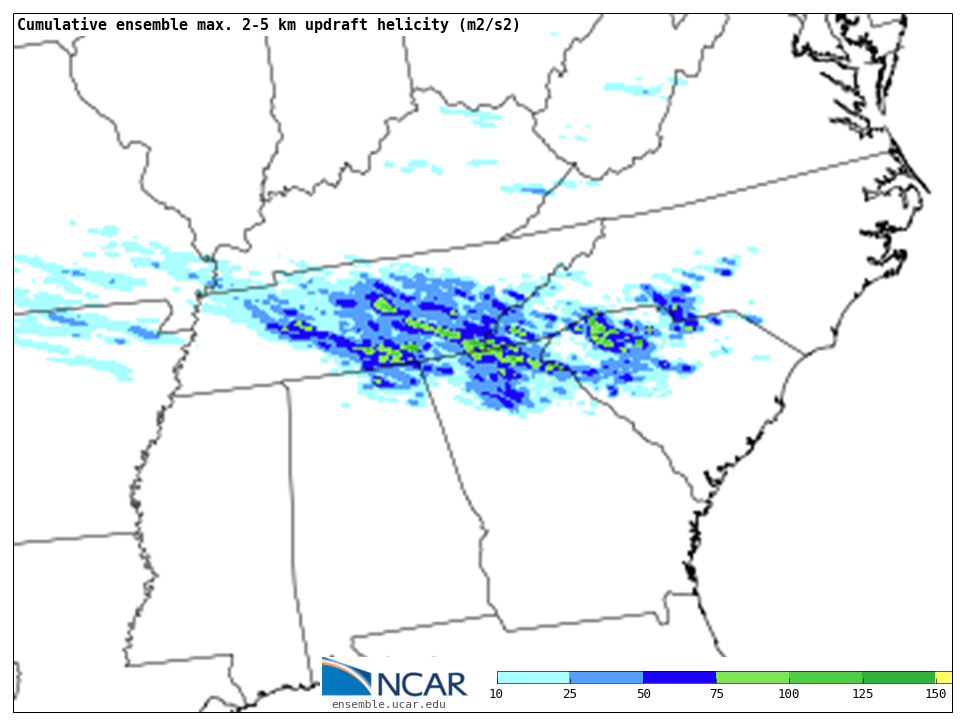
Cumulative ensemble maximum 2-5 km updraft helicity, from the NCAR Ensemble, valid 0100 UTC 22 March 2017
The benefits of using a highly accurate CAM to give large lead times for threatening weather (and even supplement operational warnings in the not-too-distant future) are immeasurable. But how can we choose the best CAM with high confidence? On occasion, the various CAMs—all with differing scale, physics, and initial conditions, among other factors—can show very different solutions regarding storm type, threat and evolution within roughly the same mesoscale environment. Selecting the most accurate solution is a major challenge for forecasters. One very worthy attempt to address this challenge has been the development of convection-allowing ensemble forecast systems. Examination of the envelope of solutions and, hopefully, zeroing in on a most likely solution can help forecasters gain confidence in a particular forecast scenario and communicate this information to the public and other users. The Storm Prediction Center has been running the Storm Scale Ensemble of Opportunity (http://www.spc.noaa.gov/exper/sseo/) in real-time for several years. More recently, the Community Leveraged Unified Ensemble (CLUE), a large ensemble forecast system under development by NCEP/EMC, has undergone initial testing as part of the NSSL Hazardous Weather Testbed (HWT). Other innovative tools have emerged from CAMs, including hourly maximum plots for fields such as updraft helicity, which add tremendous value by enabling forecasters to gather crucial information about potential storm intensity and track at a glance, as well as neighborhood probabilities that consider CAM ensemble member output near each grid point to establish the chance of meeting a particular threshold at that location.
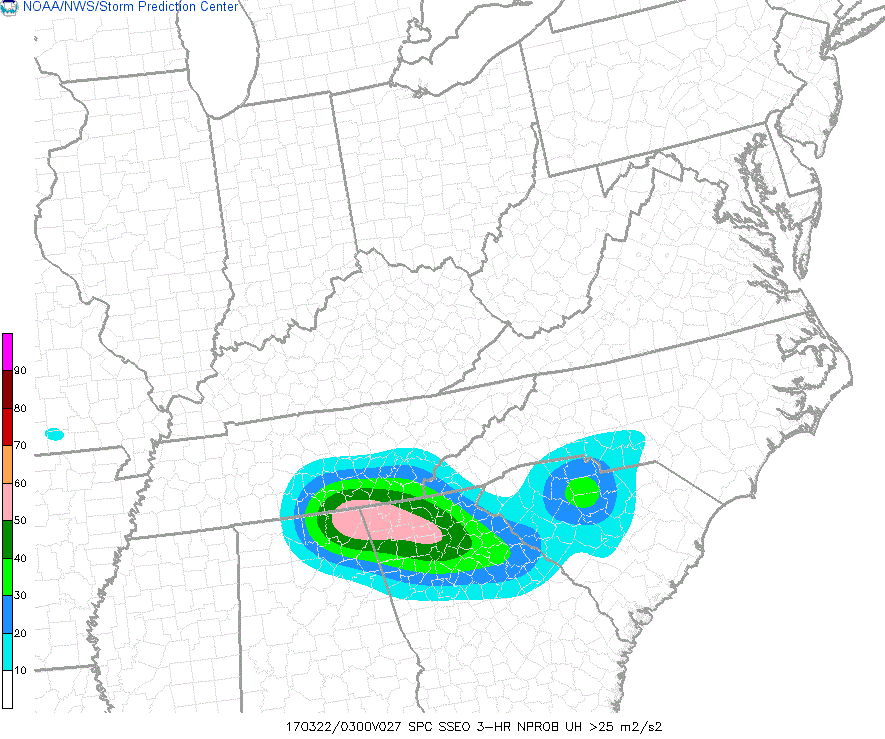
Neighborhood 3-hr probability of updraft helicity over 25 m2 s-2, from the SPC SSEO, valid 0300 UTC 22 March 2017
Of course, CAMs aren’t just being used in public sector warning and outlook services. Simulated radar imagery has been commonplace in broadcasting for many years as a way to show the public storm timing, coverage, and intensity. These depictions of forecast reflectivities, along with projected short-term storm paths generated via weather software packages, have been revolutionary in helping broadcast meteorologists communicate storm details to the public and encourage appropriate responses.
But we all need to take great care in how we assimilate CAMs into our forecast and warning processes. The real-looking appearance of simulated radar imagery can entice both forecasters and the public to view it as fact rather than a modeled solution that may or may not be correct, leading us down a potentially treacherous path. Storm-scale modeling is still not perfect, and errors with timing and structure persist. We need to remember that, regardless of the sometimes gorgeous and realistic appearance of simulated radar, it is merely one tool among many used in forecast and warning decision-making and communication. As the world of CAMs explodes, it is our responsibility to exercise caution in interpretation and ensure that the power of CAMs is applied wisely.


